


How to Query The Graph Protocol for Onchain Data using Python
A step-by-step guide on querying Subgraphs using Python, GraphQL, and Subgrounds.


In this tutorial, we will query the ENS Subgraph using two methods; raw GraphQL query and Subgrounds library by Playgrounds.
The goal is for you to be able to:
query any Subgraph data using Python
understand the two querying methods
What are Subgraphs anyway?
The TL;DR definition of The Graph protocol is described by Tegan Kline, a Co-Founder of The Graph protocol, in her tweet;
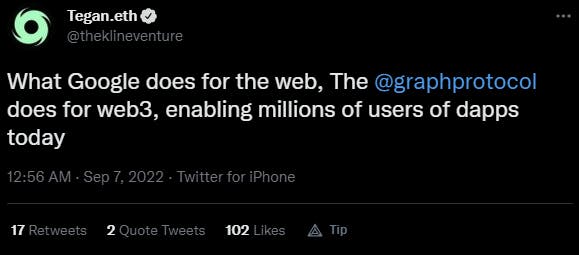
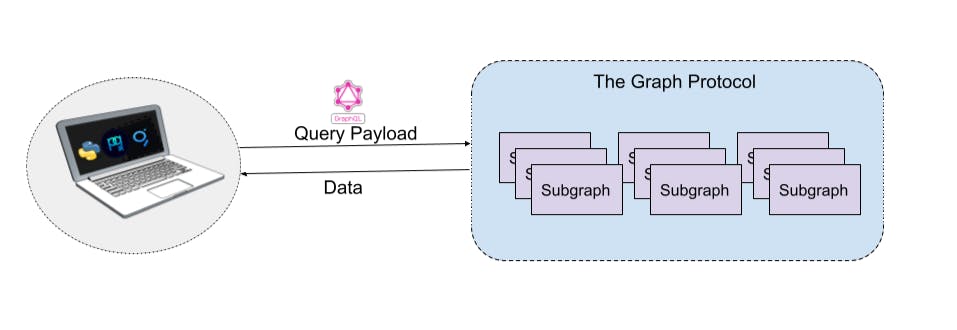
The Graph is a decentralized indexing protocol that allows developers to build open-source APIs called subgraphs to query networks like Ethereum, IPFS, and other supported chains. There are 522, and growing, subgraphs deployed at the time of writing. Anyone can query subgraphs for on-chain data, as we will in this tutorial.
Now let’s get querying!
Tech Stack
Coding Language: Python
IDE/Coding Platform: Jupyter Notebook (Anaconda)
GraphQL: open-source data query language(”QL” part of GraphQL) used for APIs
Blockchain API: Subgraph(ENS Subgraph for demo purposes)
Getting Started
Requirements: To follow this tutorial, you will need Python 3.10 and Anaconda installed on your system.
Using Raw GraphQL to Query Subgraphs with Python
Step 1: Setup coding environment
Once you have installed Python and Anaconda, open your command line, create a folder, and change the directory into your folder:
mkdir <your_folder_name> && cd <your_folder_name>
Create a Python virtual environment to keep our project dependencies isolated:
python -m venv env
Activate the virtual environment (env); you should see the name of the environment prefixed after successful activation as such,(env) C:\ :
.\env\Script\activate
Now that we have our environment up and ready, let’s install some libraries that our project will depend on for querying data:
pip install pandas requests
To confirm you have the needed packages (pandas and requests), use pip to check:
pip freeze
Since we will be using the virtual environment in Jupyter Notebook, we need to add it as such:
- install the ipykernel package, which provides the IPython kernel for Jupyter:
pip install --user ipykernel
- add virtual environment to Jupyter by typing:
python -m ipykernel install --name=env
After running the command above, you should see something like this:
Installed kernelspec env in C:\ProgramData\jupyter\kernels\env
The final step of the setup is to open Jupyter Notebook; run this command:
jupyter notebook
A tab will open in your browser with Jupyter on localhost.
Locate the “New” tab and choose env to open a notebook with your created virtual environment.
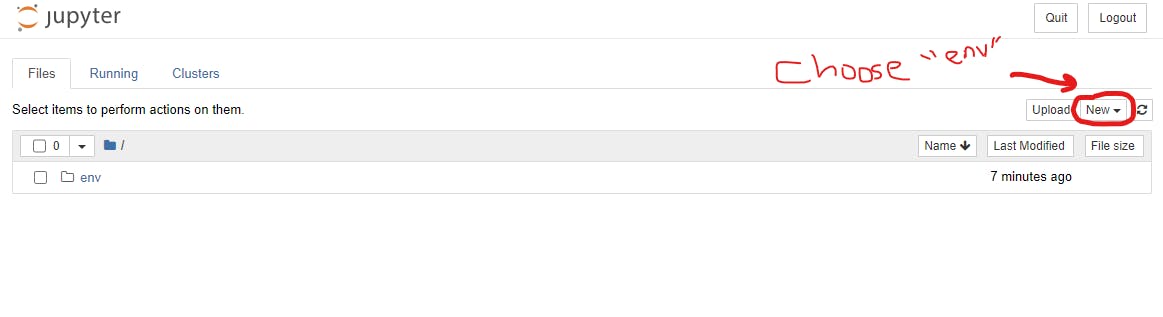
Now we are ready to roll!
Step 2: Prepare raw query
For this tutorial, we will query the ENS(Ethereum Name Service) Subgraph for some fun data. ENS is a naming system based on the Ethereum blockchain. The common use of ENS has been to map human-readable domain names like vitalik.eth to machine-readable Ethereum addresses. ENS is very popular in the Web3 space; hence the high activity of registrations as seen on ENS Etherscan Registrar Controller.
Let’s say we are interested in obtaining the latest data about registered domains to answer these questions;
what are the latest domain names registered?
who are the registrants of the names (hexadecimal ETH addresses)?
when did the registration happen?
what was the cost of registration in ETH?
what is the expiry date of the domain names?
The Graph protocol provides a playground and explorer where anyone can write custom queries to pull data from any given subgraph.
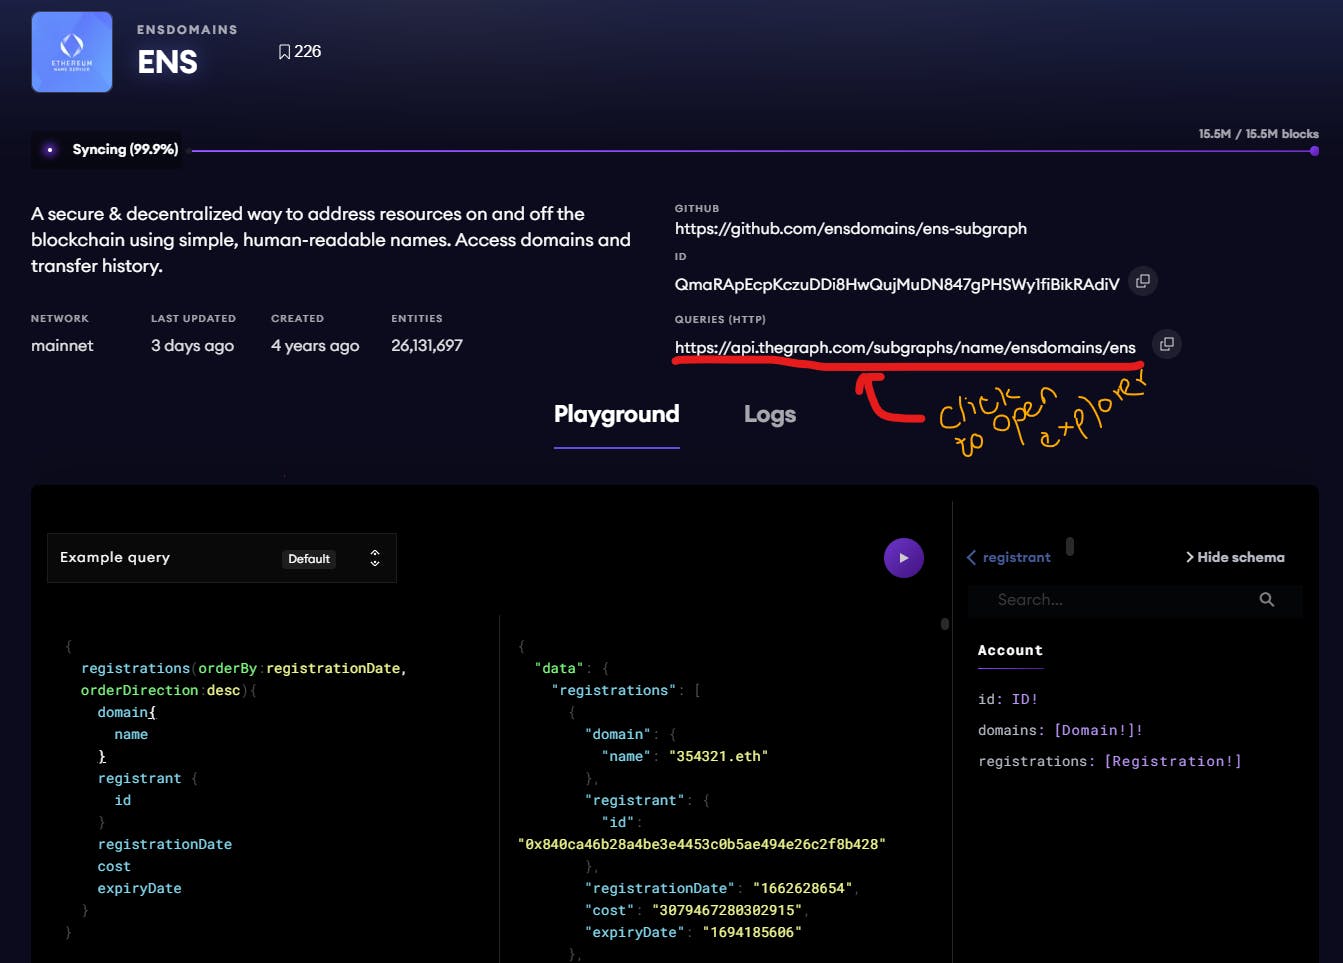
The explorer is much easier to use because of the radio buttons compared to the playground, where you must manually type the queries.
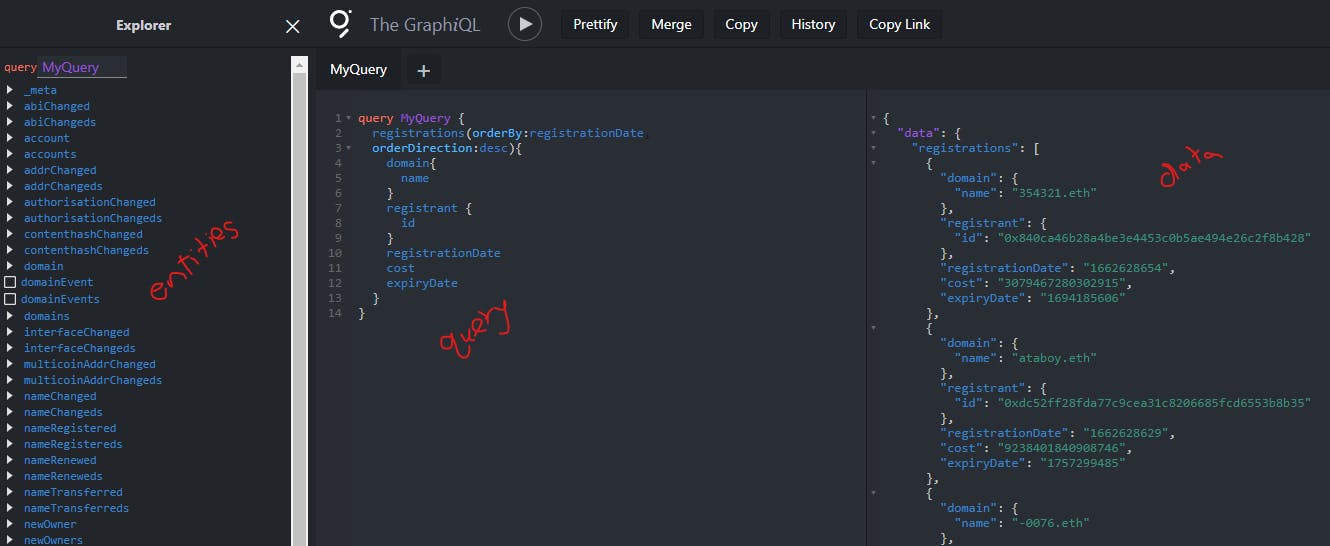
We will play around with the explorer by selecting entities and querying data until we find a query that returns the data to answer our questions above; this is the final query:
query ENSData {
  # latest 1000 ENS registrations
  registrations(first:1000, orderBy:registrationDate, orderDirection:desc){
    domain{
      name # like`vitalik.eth`
    }
    registrant {
      id # hexadecimal address
    }
    registrationDate
    cost
    expiryDate
  }
}
Step 3: Query with Python in Jupyter Notebook
It is time to use Python to get data using the query we prepared above.
In our Jupyter Notebook, created earlier, use the first cell to import the dependencies we will need;
import pandas as pd
import requests
Now let’s save our query above in a variable and create a function that will handle sending the payload (query) to make an API call to the ENS subgraph and receive data:
# variable holding the query payload
query = """
{
    registrations(first:1000, orderBy:registrationDate, orderDirection:desc){
        domain{
            name
        }
        registrant {
            id
        }
        registrationDate
        cost
        expiryDate
    }
}
"""

def get_data(query):
    """This function posts a request to make an API call to ENS Subgraph URL
    parameters:
    ------------
    query: payload containing specific data we need
    return:
    -------
    response.json(): queried data in JSON format
    """

    response = requests.post('https://api.thegraph.com/subgraphs/name/ensdomains/ens'
                             '',
                             json={"query":query})

    if response.status_code == 200: # code 200 means no errors
        return response.json()
    else: # if errors, print the error code for debugging
        raise Exception("Query failed with return code {}".format(response.staus_code))
Make sure you run each cell up to this point using the run button on the Notebook or Ctrl + Enter on the keyboard. The final step to get data is to invoke the function and pass in the query:
data = get_data(query)
display(data)
Your output from running the function will be in nested JSON + list format.
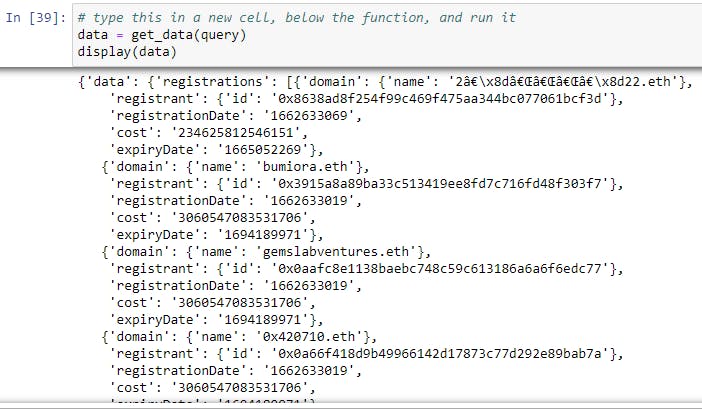
And voilà, we have queried the latest ENS registration data that we need to answer our initial questions!
The next steps you can take would be to flatten the data, load it into pandas DataFrame, and clean up the data. The Epoch Times (registrationDate and expiryDate) would need to be converted to Unix Timestamp, which is more human-readable. The same goes for converting cost from Wei to ETH.
Now that we have queried data the 'more manual' way, let’s look at an 'easier' way of doing the same but with more robust advantages using Subgrounds.
Using Subgrounds Python Library to Query Subgraphs
What is Subgrounds?
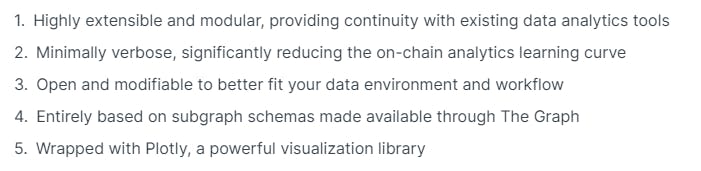
Subgrounds is an open-source data access layer for querying, manipulating, and visualizing subgraph data. The library makes it easy for data professionals—or anyone—to access on-chain data in a familiar web2 stack. These are some of the highlighted benefits of using subgrounds;
Step 1: Import and initialize subgrounds in Jupyter
In a new Jupyter Notebook cell below the last code above, import subgrounds and run the cell:
from subgrounds import Subgrounds
Initialize Subgrounds:
sg = Subgrounds()
Step 2: Load ENS subgraph URL and create Field Paths
Load the ENS subgraph using its API URL, which you can find it here:
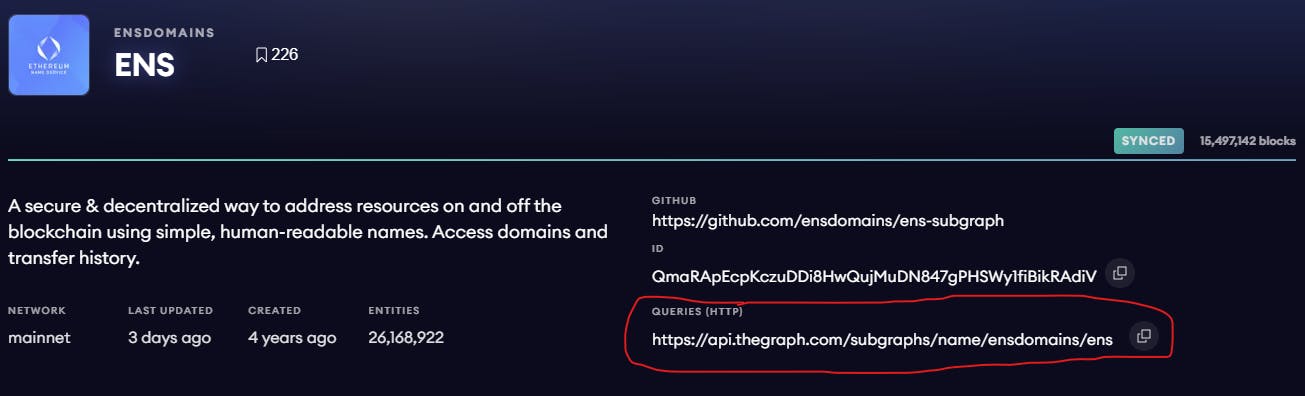
# load ENS subgraph
ens = sg.load_subgraph('https://api.thegraph.com/subgraphs/name/ensdomains/ens')
Subgrounds provides options for getting data in different formats; query, query_df, and query_json. Since we need to do some analysis with our data, we will choose to have our data in a pandas DataFrame using query_df.
We will also have our data normalized by the library and use the SyntheticFields function to define a human-readable timestamp format transformation before querying. Let’s import the SyntheticField method from subgrounds and define synthetic fields for both registrationDate and expiryDate:
from subgrounds.subgraph import SyntheticField

# registrationdate synthetic field
ens.Registration.registrationdate = SyntheticField(
    lambda registrationDate: str(datetime.fromtimestamp(registrationDate)),
    SyntheticField.STRING,
    ens.Registration.registrationDate
)

# expirydate synthetic field
ens.Registration.expirydate = SyntheticField(
    lambda expiryDate: str(datetime.fromtimestamp(expiryDate)),
    SyntheticField.STRING,
    ens.Registration.expiryDate
)
Now we are ready to add Field Paths, the main building blocks used to construct Subgrounds queries. Field Path is a translation of the raw GraphQL schema starting from the root query entity down to the scalar leaf entity:
# Select the latest 1000 registration names by registration datetime
registrations = ens.Query.registrations(
    first=1000, # latest 1000 registrations
    orderBy=ens.Registration.registrationDate, # order registrations by time
    orderDirection="desc" # latest registration data will be first
)

field_paths = [
    registrations.domain.name, # ens domain like "vitalik.eth"
    registrations.registrant.id, # hexadecimal eth address
    registrations.registrationdate, # time in epoch format
    registrations.cost, # price for registration
    registrations.expirydate # expiry date of domain
]
Step 3: Query Time!
Now that we have the payload ready, let’s send the request for data and display the first five results:
# get data
df = sg.query_df(field_paths)

# print the first five results
df.head()
The output will look like this:
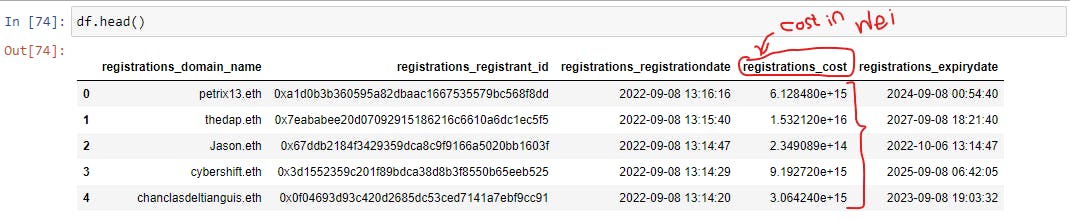
Boom! We got ourselves some interesting near real-time on-chain data!
Step 4: Perform some Transformations on the Data
Now that we have completed the Extract part of our ETL(Extract, Transform, and Load) process, we proceed to Transform. FYI, we won’t be performing the Load stage of ETL, but you can if you like.
The first item in our transformation is to convert the registrations_cost column values from Wei(smallest denomination of ether) to ether:
# Convert `registrations_cost` column from wei to ether
# 1 ether = 1,000,000,000,000,000,000 wei (10^18)
df['registrations_cost'] = df['registrations_cost'] / (10**18)
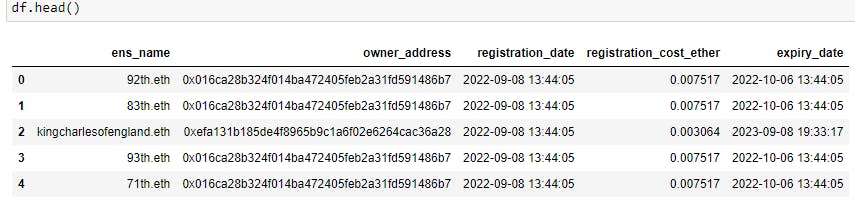
The next item would be to rename the columns for simplicity and standardization:
# rename columns for simplicity
df = df.rename(columns={'registrations_domain_name': 'ens_name',
                        'registrations_registrant_id': 'owner_address',
                        'registrations_registrationdate': 'registration_date',
                        'registrations_cost': 'registration_cost_ether',
                        'registrations_expirydate': 'expiry_date'
                        })
# inspect the changes in df
df.head()
Final dataframe sample:
What’s Next?
If you’re interested in digging into the data to derive some fun insights, put on your data analyst monocle and dive into the data! You can interrogate the data to find the average registration cost over a period or create a dashboard to track trending topics extracted from registered names.
Share your hacks and learnings! You can find me on Twitter @ynot_kip if you have any questions or say hi!
GitHub Repo
More Resources
The Graph:
About The Graph and How The Graph Works and Querying Best PracticesSubgrounds:
Subgrounds Workshop and Subgrounds DocsGraphQL:
Introduction to GraphQL